
Википедиа:Graphics Lab/Resources/OpenJUMP/Create a general map
Tools
[вироиши манбаъ]This tutorial will describe the steps for creating a general historical map of the British Isles using the open-source GIS software Open JUMP and Inkscape.
It requires some proficiency with Inkscape and basic GIS skills.
Tools:
- Open JUMP PLUS 1.8.0 download link or the latest Open JUMP PLUS snapshot download link
- Inkscape v. 0.48.5 or 0.91 download link
Reference map
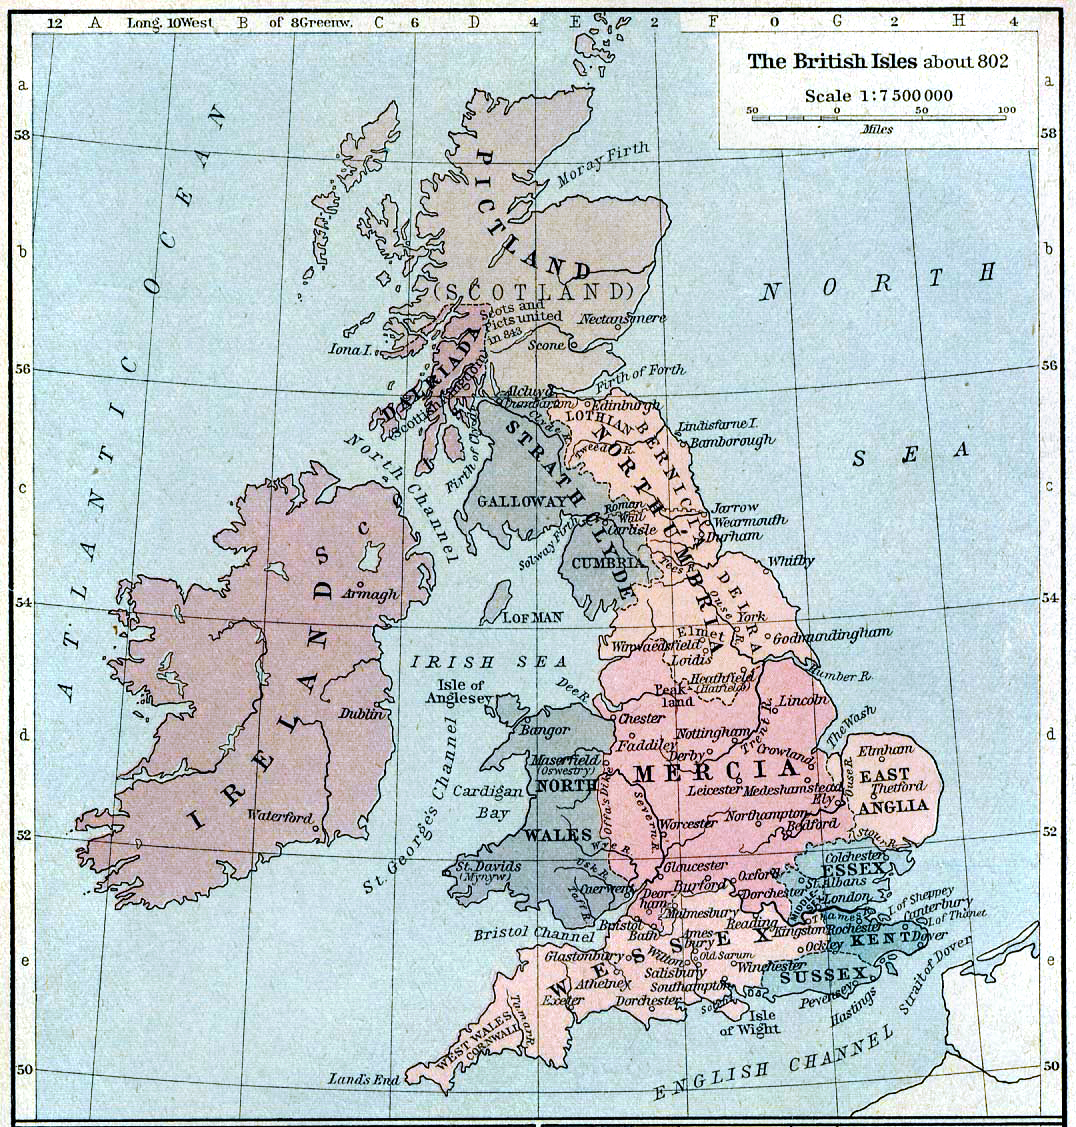
[вироиши манбаъ]The reference map used in this tutorial, "British Isles in about 802", is from the Historical Atlas of William Shepherd (Shepherd, William R., 1926, Historical Atlas, New York City: Henry Holt and Company) https://commons.wikimedia.org/wiki/File:British_isles_802.jpg
This map has been geo-referenced using the WorldMap WARP tool and can be downloaded from this address: download link
Map data
[вироиши манбаъ]The background geographic data used in this tutorial is made up of 4 datasets downloaded from the Natural Earth website (http://www.naturalearthdata.com/downloads/10m-physical-vectors/ ):
- Coastline link
- Rivers + lake centerlines link
- Rivers + lake centerlines - Europe supplement link
- Lakes + Reservoirs link
Creating the map in Open JUMP GIS and Inkscape
[вироиши манбаъ]
Step 1: Importing files, cropping and styling vector data
[вироиши манбаъ]

1. Start Open JUMP GIS and use File -> Open to open Shepherd's geo-referenced map of the British Isles. Click Next and Finish.

2. Now use File -> Open again and import the 4 vector datasets that were downloaded from the Natural Earth website.

3. The vector data extends too much, so we will crop it to the area needed for our map. Right-click on the layers menu and Add a new layer (or Ctrl+L). Name this new layer Fence (it has to be this exact name for our next operation).

4. The Editing Toolbox will open by default when you add a new layer (alternatively it can be opened from View -> Editing Toolbox). With the Draw Rectangle Tool from the editing toolbox draw a rectangle that fully contains the map of the British Isles.

5. Now the map will be cropped using the Edit -> Clip map to Fence command. In the next step click OK.

6. This is a proper time to edit the style of our layers. This is done from the Change Styles menu (Change Styles icon on the top level menu bar or right-click on layer Style -> Change Styles). Remove the Fill for the Fence layer and set the transparency to 0. Use a shade of blue (RGB 0099FF for example) for the lines on the coastline, rivers and lakes layers.
Tip: to "borrow" the graphic style from another layer right-click on the layer with the style you want to copy and go to Style -> Copy Styles. Now right-click on the target layer (or layers if you Shift+left click more layers) and apply the Style -> Paste Styles command.
Tip 2: To save new layers right-click on the layer and go to Save Dataset As. The same process applies to raster layers (in our case Shepherd's map), but you will have to save the raster in JUMP GML format (*.jml), otherwise the layer will not be saved as part of our Open JUMP project.
For vector layers you can save your data in about 10 GIS or CAD formats. The JUMP GML format has the advantage of keeping all the spatial information and layer attributes in a single file (unlike ESRI shapefile for example, where datasets come as .shp, .dbf, .shx and .prj files).
 |
 |
| Copy and Paste Style | Saving layers |
Step 2: Editing and labelling vector data
[вироиши манбаъ]
7. Create a new layer (named BORDERS in my example) where we will add the borders of the political entities in Britain. There are some things to know before we start drawing:
- A layer is Editable when marked with red bold text in the layer list. When the name is shown in italics the layer is not Selectable. You can change the layer modes from the right-click context menu. When making edits to a layer it is advisable to uncheck both the Selectable and Editable modes for all the other layers.
- The snapping options can be changed from the Editing Toolbox Options menu. In our case we will only need to Snap to vertices and to LineStrings being edited (the preset tolerance of 10px is fine). The vertices or nodes we will snap to belong to the coastline and rivers datasets.
- You can adjust the transparency of the background reference map from right-click on layer -> Layer Properties -> Styles
- To Zoom In or Out you can use the standard Zoom In/Out tool from the top menu bar. While editing, the combination Alt+mouse scroll is more suitable. For panning use the Shift+Alt+left click drag combination. To delete previous node while drawing a line or polygon use Backspace. To temporarily disable snapping use the Spacebar key. More information about shortcut keys can be found at Help -> Shortcut Keys.
 |
 |
 |
| Changing layer modes | Snapping options | Adjusting raster layer transparency |

8. Add the borders using the Draw Linestring Tool. Do not draw lines in places where a river from our Natural Earth datasets forms the border. To continue a finished line start drawing from either the first or last node of the linestring.
9. The borders have to connect to nodes from the shoreline and rivers datasets. You can edit nodes using the keys V (move node), X (delete node) and A (insert node) or the Move Vertex, Delete Vertex and Insert Vertex tools from the Editing Toolbox. To temporarily disable snapping while editing nodes/vertices use the Spacebar key. Additionally, edit the coastline layer to match the historical shoreline in Kent and Northern Flanders and edit the course of the Ouse River in the area around Ely. Use the Split Lines tool to split the coastline in Northern Flanders and draw the estuaries.
 |
 |
 |
| Splitting line | Deleting nodes | Adding the historical coastline |
10. Note that the 2 river layers have some topological errors. In 5 places the rivers don't snap to the coastline layer. You will have to Zoom In to each area to see the errors better. Either move and snap the nodes individually or use the Snap Vertices Tool for faster results.
 |
 |
 |
| Topological errors to be corrected | Moving a node (vertex) with the Move Vertex Tool | Using the Snap Vertices Tool to correct the topology |

11. In a new layer (SETTLEMENTS) we will add some settlements using the Draw Point Tool. I have added 15 settlements that were more important in Anglo-Saxon Britain and in pre-Norman Ireland: Armagh, Dublin, Waterford, Bamburgh (Bamborough), Durham, York, Leicester, Exeter, St. Davids, Winchester, Canterbury, London, Rochester, Edinburgh, Scone. You should disable all snapping options before inserting points.
Note: The quality of the source map has been reduced during the geo-referencing process. View the original file if some text is illegible (link).

12. To write the names of the settlements we first need to add a "NAME" attribute field to the layer. This is done from the layer Schema menu. Right-clik on layer -> Schema -> View/Edit Schema and add a new field (NAME) with the Data Type set to String. Click Apply Changes and close the menu.

13. Open the layer Attributes table (right-click on layer -> View/Edit Attributes or from the top menu bar View/Edit Attributes icon) and add the names of each settlement. If you Zoom to Full Extent you can Flash Selected Rows or simply click on a row to highlight a point on the map.

14. To show the labels on the map open the Change Styles menu and go to Labels. Check Enable labelling, use the field with the settlement names for the Label attribute parameter and, optionally, change Font and text Height.

15. From Rendering (Change Styles menu) style the points in a more appropriate way (remove fill, black line, check to show Vertices, Point Display Type set to Circle)
IMPORTANT: Open JUMP cannot display curved labels yet, so the country/province and geographical names will be added in Inkscape.
Step 3: Reprojecting vector data, creating polygons and exporting the map
[вироиши манбаъ]

16. Our data will be reprojected from the Geographic projection (the projection of the Natural Earth data and source map) to a more British Isles-suitable projection. Turn all the vector layers (not the raster source map) to Editable (use Shift to select multiple layers). Then Shift+select all vector layers and go to Plugins -> Coordinate Transformation. Write 4326 in the Source coordinate system field (this is the EPSG code of the Geographic/Equirectangular projection) and 32630 (UTM projection) in the Target coordinate system field.

17. Delete the existing Fence layer and add a new one. Draw a rectangle around the British Isles and crop the map for the final layout.
18. Add a new layer (LANDS). Have the fence, borders, coastlines and the rivers layers set to Selectable and Shift+select them. Select all the features in the 4 layers (Ctrl+A) and Paste them (Ctrl+V) in the new layer. Go to Tools -> Edit Geometry -> Convert -> Polygonize and check Node input before polygonizing. Delete the "Dangles" and "Lands" layers and move the newly generated layer up in the list.
 |
 |
 |
 |
| Ctrl+A to select features | Pasting the features (Ctrl+V) in the new layer (LANDS) | Applying Polygonization | Moving the generated layer below the other vector layers in the layer list |

19. Set the LANDS-Polygons layer to Editable and Selectable. Cut (Ctrl+X) the sea&ocean polygon and paste it (Ctrl+V) to the lakes layer

20. Uncheck Selectable and Editable for all the vector layers, except the LANDS-Polygons layer. Use Ctrl+M to merge/group the polygons belonging to the same political units (small islands and "mainland"). With the Pick Color Tool color the political entities.

21. Once all the polygons have been grouped and colored, the final graphic edits can be made. I have colored the borders layer in grey (line width was changed to 1px) and moved the lakes (water bodies) layer on top of the rivers layers. The fill for the water bodies is light blue (RGB EBFBFB) and the stroke color was changed to medium-blue (RGB 80B3FF).
22. The map is ready for export. Go to the PrinterPlugIn (File -> Print -> As Map To Printer, Image, PDF (Cadplan) or the Printer icon from the top menu bar). Set the scale to 1 : 4 000 000. Add the "Furniture" (North arrow and map scale). In the map scale menu set the Value Scale to 1000. Go to Save Image and save the map as PDF.
 |
 |
 |
 |
| Changing scale to 1:4000000 in the PrinterPlugIn | Adding the North arrow | Adding the scale bar | Saving the map as PDF |
Step 4: Adding text and final edits in Inkscape
[вироиши манбаъ]

23. Open the PDF file in Inkscape (right-click on file -> Open with -> Inkscape in Windows). Keep the existing PDF import settings. Click OK.

24. Ungroup the map objects (Shift+Ctrl+G). Apply 3 ungroup commands to ungroup all the objects.

25. Move the overlapping labels in the South-East of England (London, Rochester, Canterbury).

26. In a new layer (Layer -> Layers, Add Layer) add the names of the political units (Mercia, Northumberland, Pictland, Essex, Ireland etc.). In my example I have used Liberation Serif font, sizes 16-22.

27. Add sea and river names. To curve labels, first drag a line with the Pencil tool. Select the text and line and apply the command: Text -> Put on Path. Afterwards remove the curved line and convert the text to path (Path -> Object to Path or Shift+Ctrl+C). For better Wikimedia rendering convert all text added in Inkscape to paths. Add the map title in a box in the upper part of the map.

28. Select the black Fence rectangle and crop the SVG document to it (File -> Document Properties - Resize page to drawing or selection).
29. The map is finished and should be similar to this one:

Links
[вироиши манбаъ]


.svg)

The table above has links to various tutorials and resources which can help in the creation of Wikipedia maps from digital georeferenced data (GIS).