
Википедиа:Graphics Lab/Resources/QGIS/Get ready
.png)

➎. Legends, icons, scale, north arrow, localizator, topographic legend are easily drag&drop added using Inkscape.

QGis (full name: Quantum GIS) is a GPL license, cross-platform (Windows, Linux, Mac), and rather friendly cartographic software application. It is a Geographic Information System (GIS) program you can use to create, view, and analyze maps. In a nutshell, a GIS associates with each geographic coordinate (dot) on Earth a specific value from some survey. The best example of this is altitude: a topographic map, like the ones you see on the right, can be created from a GIS file in which each pixel represents not only a geographic coordinate, but also information about its altitude. Reversely, objects can be placed on a map and associated with specific coordinates; this is commonly used for features such as roads, bodies of water, state or province borders, urban areas, etc. As a result, these features are georeferenced on separate layers and their shape and location match their actual appearance on the surface of the Earth.
This approach radically changes the process of making maps. Formerly, the mapmaker or graphist had to personally draw each layer of a map, then combine them into an image. The work's reliability and precision were limited by the user's resources and knowledge. Now, the mapmaker can collect precise GIS data from reliable sources and simply load them into QGis. Objects will be automatically placed in their exact coordinates, allowing the user to apply custom styles and output an accurate basemap, which may be the end product, or a background to host additional custom layers (icons, labels, a legend, etc.). For Wikipedia, the advantages of GIS maps are precision, reliability, consistency, and an upgrade in visual elegance of the final images. Using QGis will be mainly helpful in generating topographic backgrounds (png, svg), shaded reliefs (png), and administrative regions or borders (png, svg), and applying various styles to them.
While GRASS GIS still seems to be the most common GIS software, it has a primarily command-line interface and can be difficult to learn and operate. Therefore, beginners will prefer QGis, which is quite powerful and user-friendly. It integrates GRASS GIS and GDAL, provides an easier to use interface for GRASS GIS, and gives the user an opportunity to improve his or her GIS mapmaking skills.
This tutorial series will teach you how to use QGis to generate reliable maps for Wikipedia. Accordingly, it is Wikipedia-centered and focuses on outputting general public encyclopedic maps while following the Wikipedia map conventions.
If you would like a more comprehensive overview of QGis and its functions, you can read the official User Guide, available in several languages.
Step 0.1: Get the tools
[вироиши манбаъ]Install QGis
[вироиши манбаъ]Find your operating system from the list below and follow the link to the appropriate installer. Please don't install the sample data sets (North Carolina, etc.); you will be downloading more complete data later.
- Windows (Standalone Installer) (fr, de) – You can also watch a video demonstrating the installation process [1], but be advised that it is out of date and describes currently inaccurate file sizes and download times.
- Linux (fr, de), for Ubuntu:
- sudo add-apt-repository ppa:ubuntugis/ubuntugis-unstable #For versions >1.7.0
- sudo apt-get update
- sudo apt-get install qgis
While QGis will allow you to open many GIS files, we are mainly concerned with .tiff (raster) and .shp (vector) files.
| If you encounter any issues, you can browse and ask questions at the QGis Forum (no more active), or another forum. |
Create some helpful folders
[вироиши манбаъ]On your desktop, or some other suitable place, create the following folders:
|
→ QGis
|
|
Step 0.2: Download the GIS data
[вироиши манбаъ] Иҷро шуд— section updated (2012/02)
There are 2 kinds of data: raster GIS files — surfaces with limited precision represented by dots (pixels) — most of time topographic data; and vector GIS files — dots, lines and polygons. Below are both the biggest families, and some links to download the files needed for this tutorial.
Topography/bathymetry
[вироиши манбаъ]
 NGDC-NOAA: ETOPO1 (2009, Public domain).   Specifics:   topography & bathymetry layer(s),  1px= 1850m (1minute arch),  all Earth (90N-90S, landmass & sea floor),  projection (?),  datum WSG 84. Files:   compressed file 326Mo,  uncompressed file 900Mo,  whole earth,  1 tiles.  —♣ Comment(s): Perfect for very large maps (ex: > France).  Editor note: For this tutorial, download: ETOPO1 Ice Surface (grid registered) or ETOPO1 Bedrock (grid-registered). nb: ETOPO1 (1px=1km²) is a better data than ETOPO2 (1px=2kmx2km).
- NASA / USGS: SRTM3 (90m) (2000, Public Domain).   Specifics:   topography layer(s),  1px= 93m (3"arch),  60⁰N-56⁰S (landmass only),  datum WGS 84. Files:   on command,  1 tiles.  —♣ Comment(s): Perfect for small areas anywhere in the world. Need to create a free account. Worth it. You will use this source frequently.  Editor note: For this tutorial, and since GIS data are quite heavy (SRTM3 90m, Aster 30m), select and download the smallest area possible (Taiwan, Hongkong are good choices with both sea and mountains).
Formerly, high precision topographic GIS datas being too big —about 60GB for the whole Earth—, these datas were split into dozens, hundreds, or thousands small tiles about some MB each. The mapmaker had to find, download, unzip, load the several needed tiles (say 10 tiles for Danemark), and manage these 10 tiles in parallel for color styles, effects, etc. However, the process is a more complex than downloading a single file. You will need to:
- Know the coordinates of the area you want to map—although you do have the option of visually selecting the area on the download page.
- Find the associated GIS files (also called tiles). SRTM files have names such as "N22E112.hgt.zip", standing for 22⁰ North, 112⁰ East.
- Download them. A small island will be made of a few files, the Korean peninsula of about a hundred, and Eurasia of more than 5,000.
- Unzip them.
- Load them into QGis.
Other GIS data
[вироиши манбаъ]- Provinces
- Naturalearthdata.com: Admin level 1 : State/Provinces polygons (10m-admin-1-states-provinces) (2009, Public domain).   Specifics:   major rivers lines layer(s),  whole earth,  projection Geographic projection(?),  datum WSG84. Files:   compressed file 14Mb,  uncompressed file 19Mb,  whole Earth,  1 tiles.  —♣ Comment(s): For location maps, large and local, and complex maps (political, military, history).
- Others existing
There are vatious other GIS layers available online. By example, Naturalearthdata.com (public domain) is a collection of easily usable GIS data with the following categories:
- cultural—human and administrative (areas or borders) for countries (L-0) and smaller administrative divisions (L-1, L-2, L-3), as well as cities and urban areas
- physical—coastlines, rivers, lakes, bathymetry, and geographic lines
- raster backgrounds—Natural Earth 2 (topographic), ocean bottom, shaded relief grey
To see our selection, go to the /Gis_sources_and_palettes subpage.
Step 0.3: Load a GIS file as a layer
[вироиши манбаъ]
Loading a GIS file adds the data into your project as a layer. For our purposes, we care about vector layers and raster layers. There are three ways you can add layers into your project: using the menu, using the keyboard shortcuts, or using the toolbar icons.
- Using the menu: go to Layer > Add Vector Layer... or Layer > Add Raster Layer..., depending on which you would like to add, and Layer > Remove Layer(s) to delete.
- Using the shortcuts: Ctrl + Shift + V (Cmd + Shift + V on Mac) to add a vector layer or Ctrl + Shift + R (Cmd + Shift + R) to add a raster layer, and Ctrl + D (Cmd + D) to remove layer(s).
- Using the toolbar: Simply click the icon corresponding to the layer type you want to add.
You can also remove a layer by selecting it in the Layers window, right clicking on it, and clicking on Remove.
Since the ETOPO1 data is a raster file, go ahead and add it to your project using whichever Add Raster Layer method you prefer.
-
 1. Adding a raster layer.
 -
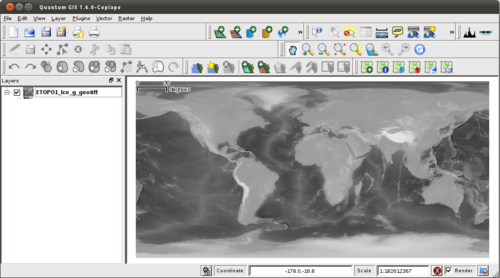 2. Topographical data will appear in grey.


Links
[вироиши манбаъ]


.svg)

The table above has links to various tutorials and resources which can help in the creation of Wikipedia maps from digital georeferenced data (GIS).